(804) 353-4500tswinfo@tswinvest.com
You are leaving TSW
You are now leaving the TSW website. This link is provided as a convenience, and Thompson, Siegel & Walmsley is not responsible for the content provided on your destination site.
You are now leaving the TSW website. This link is provided as a convenience, and Thompson, Siegel & Walmsley is not responsible for the content provided on your destination site.
As a brief prelude and introduction, we would highlight that TSW is a value manager that has been applying a consistent and dedicated approach to value investing for more than 50 years. On the domestic side of the house, we would classify ourselves as having a price sensitive, traditional value approach to investing that we believe positions our style as advantageously as we can remember in our firm’s history. This view is predicated on the fact that there has never been a larger disconnect between U.S. growth and value equity styles as we’re living in a 16+ year growth cycle in U.S. equities that surpassed what occurred in the dot.com era. We highlight this because the significant dichotomy between the two styles amidst a recent hyper speculative backdrop in the most expensive U.S. equity market in history, has resulted in notable differences in index construction amongst styles. This has created, in our view, drastic differences in opportunity sets from the perspective of active management going forward, specifically:
A) Concentration levels of U.S. growth and core indices have increased significantly relative to history; while on the value side, these concentration levels have decreased significantly.
B) Correlation of U.S. equity value indices versus the broad U.S. equity market and other styles have been notably lower when compared to their history. The opportunity sets between growth and value indices therefore have created heightened dispersion, resulting in greater diversification on the value side that we believe has not been fully appreciated.
C) This significant diversification expansion in value indices has contributed to a historic bifurcation between more expensive and cheaper cohorts of stocks even within value indices. Substyles of value in U.S. equities, therefore, have become, in our estimation, incredibly important when assessing peer comparisons, and the opportunity that lies ahead.
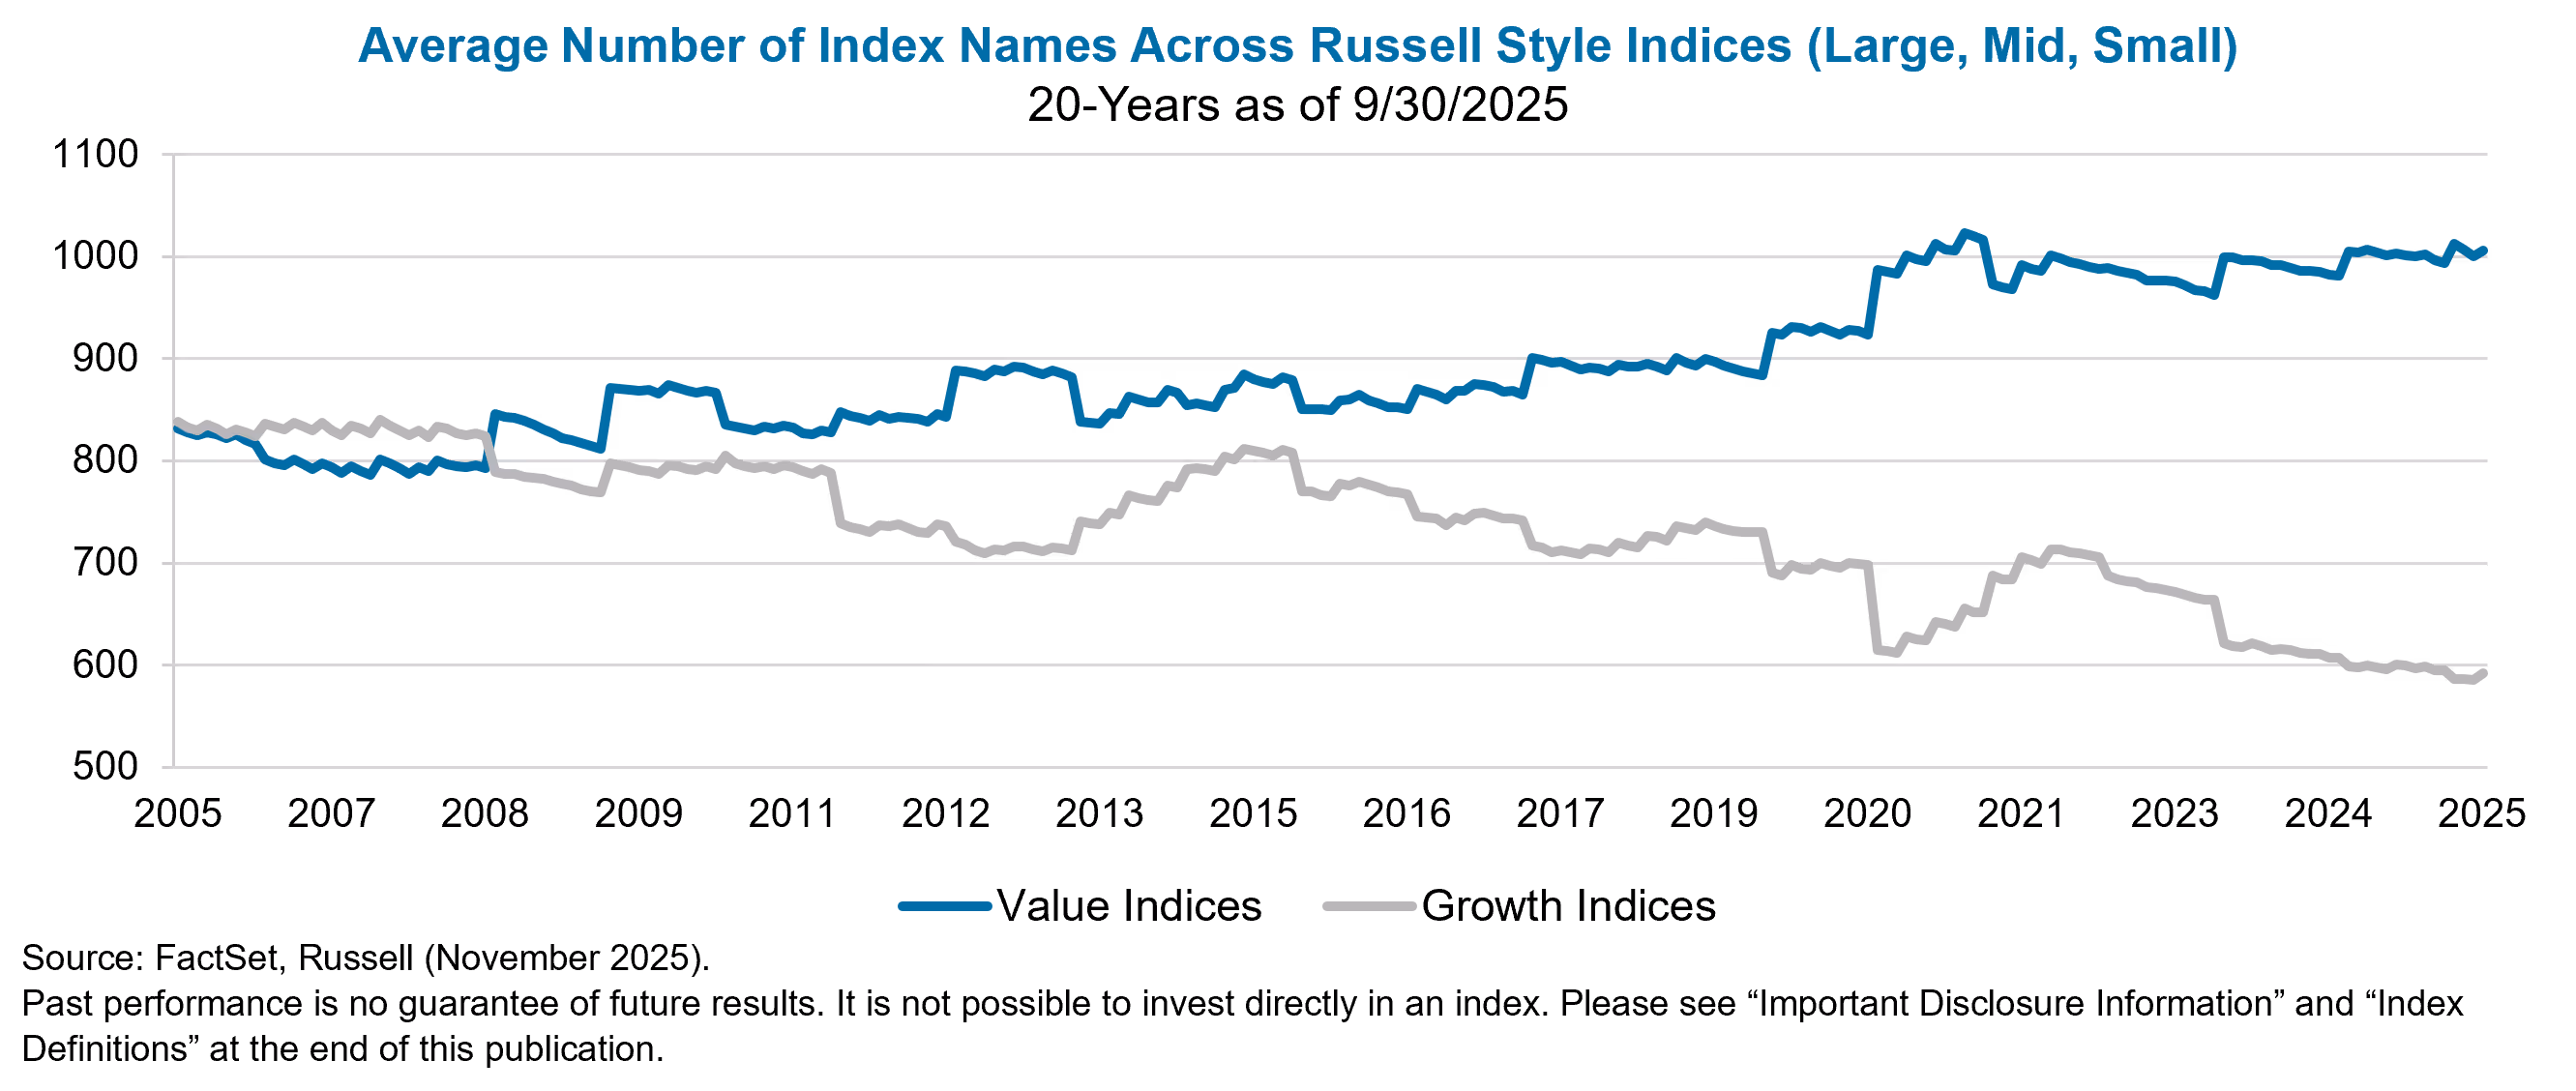
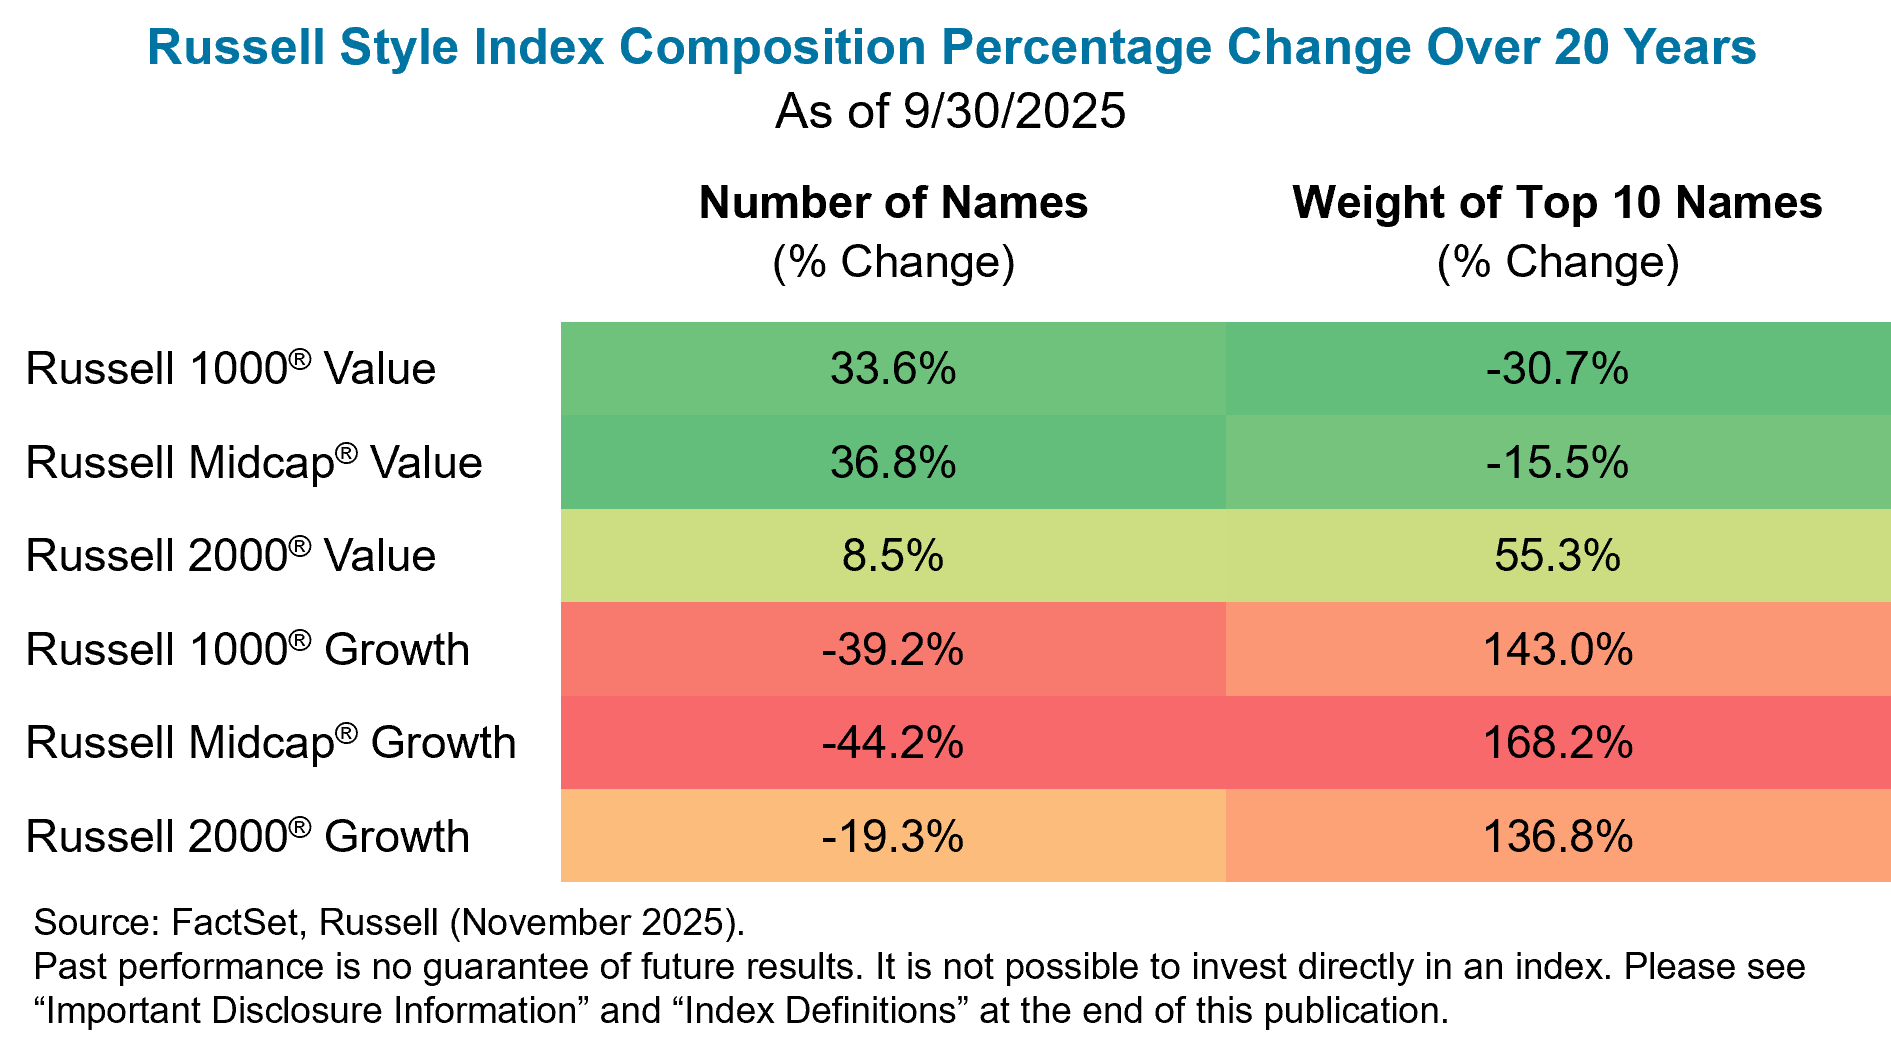
Although the increased concentration is often viewed as a large-cap phenomenon, the data below further shows that both small- and mid-cap growth indices have also seen a significant decline in the number of constituents, along with a rising share of weight in their top 10 holdings. In aggregate, it has had the opposite impact on the value side of the coin.
Heightened Risk-On Behavior
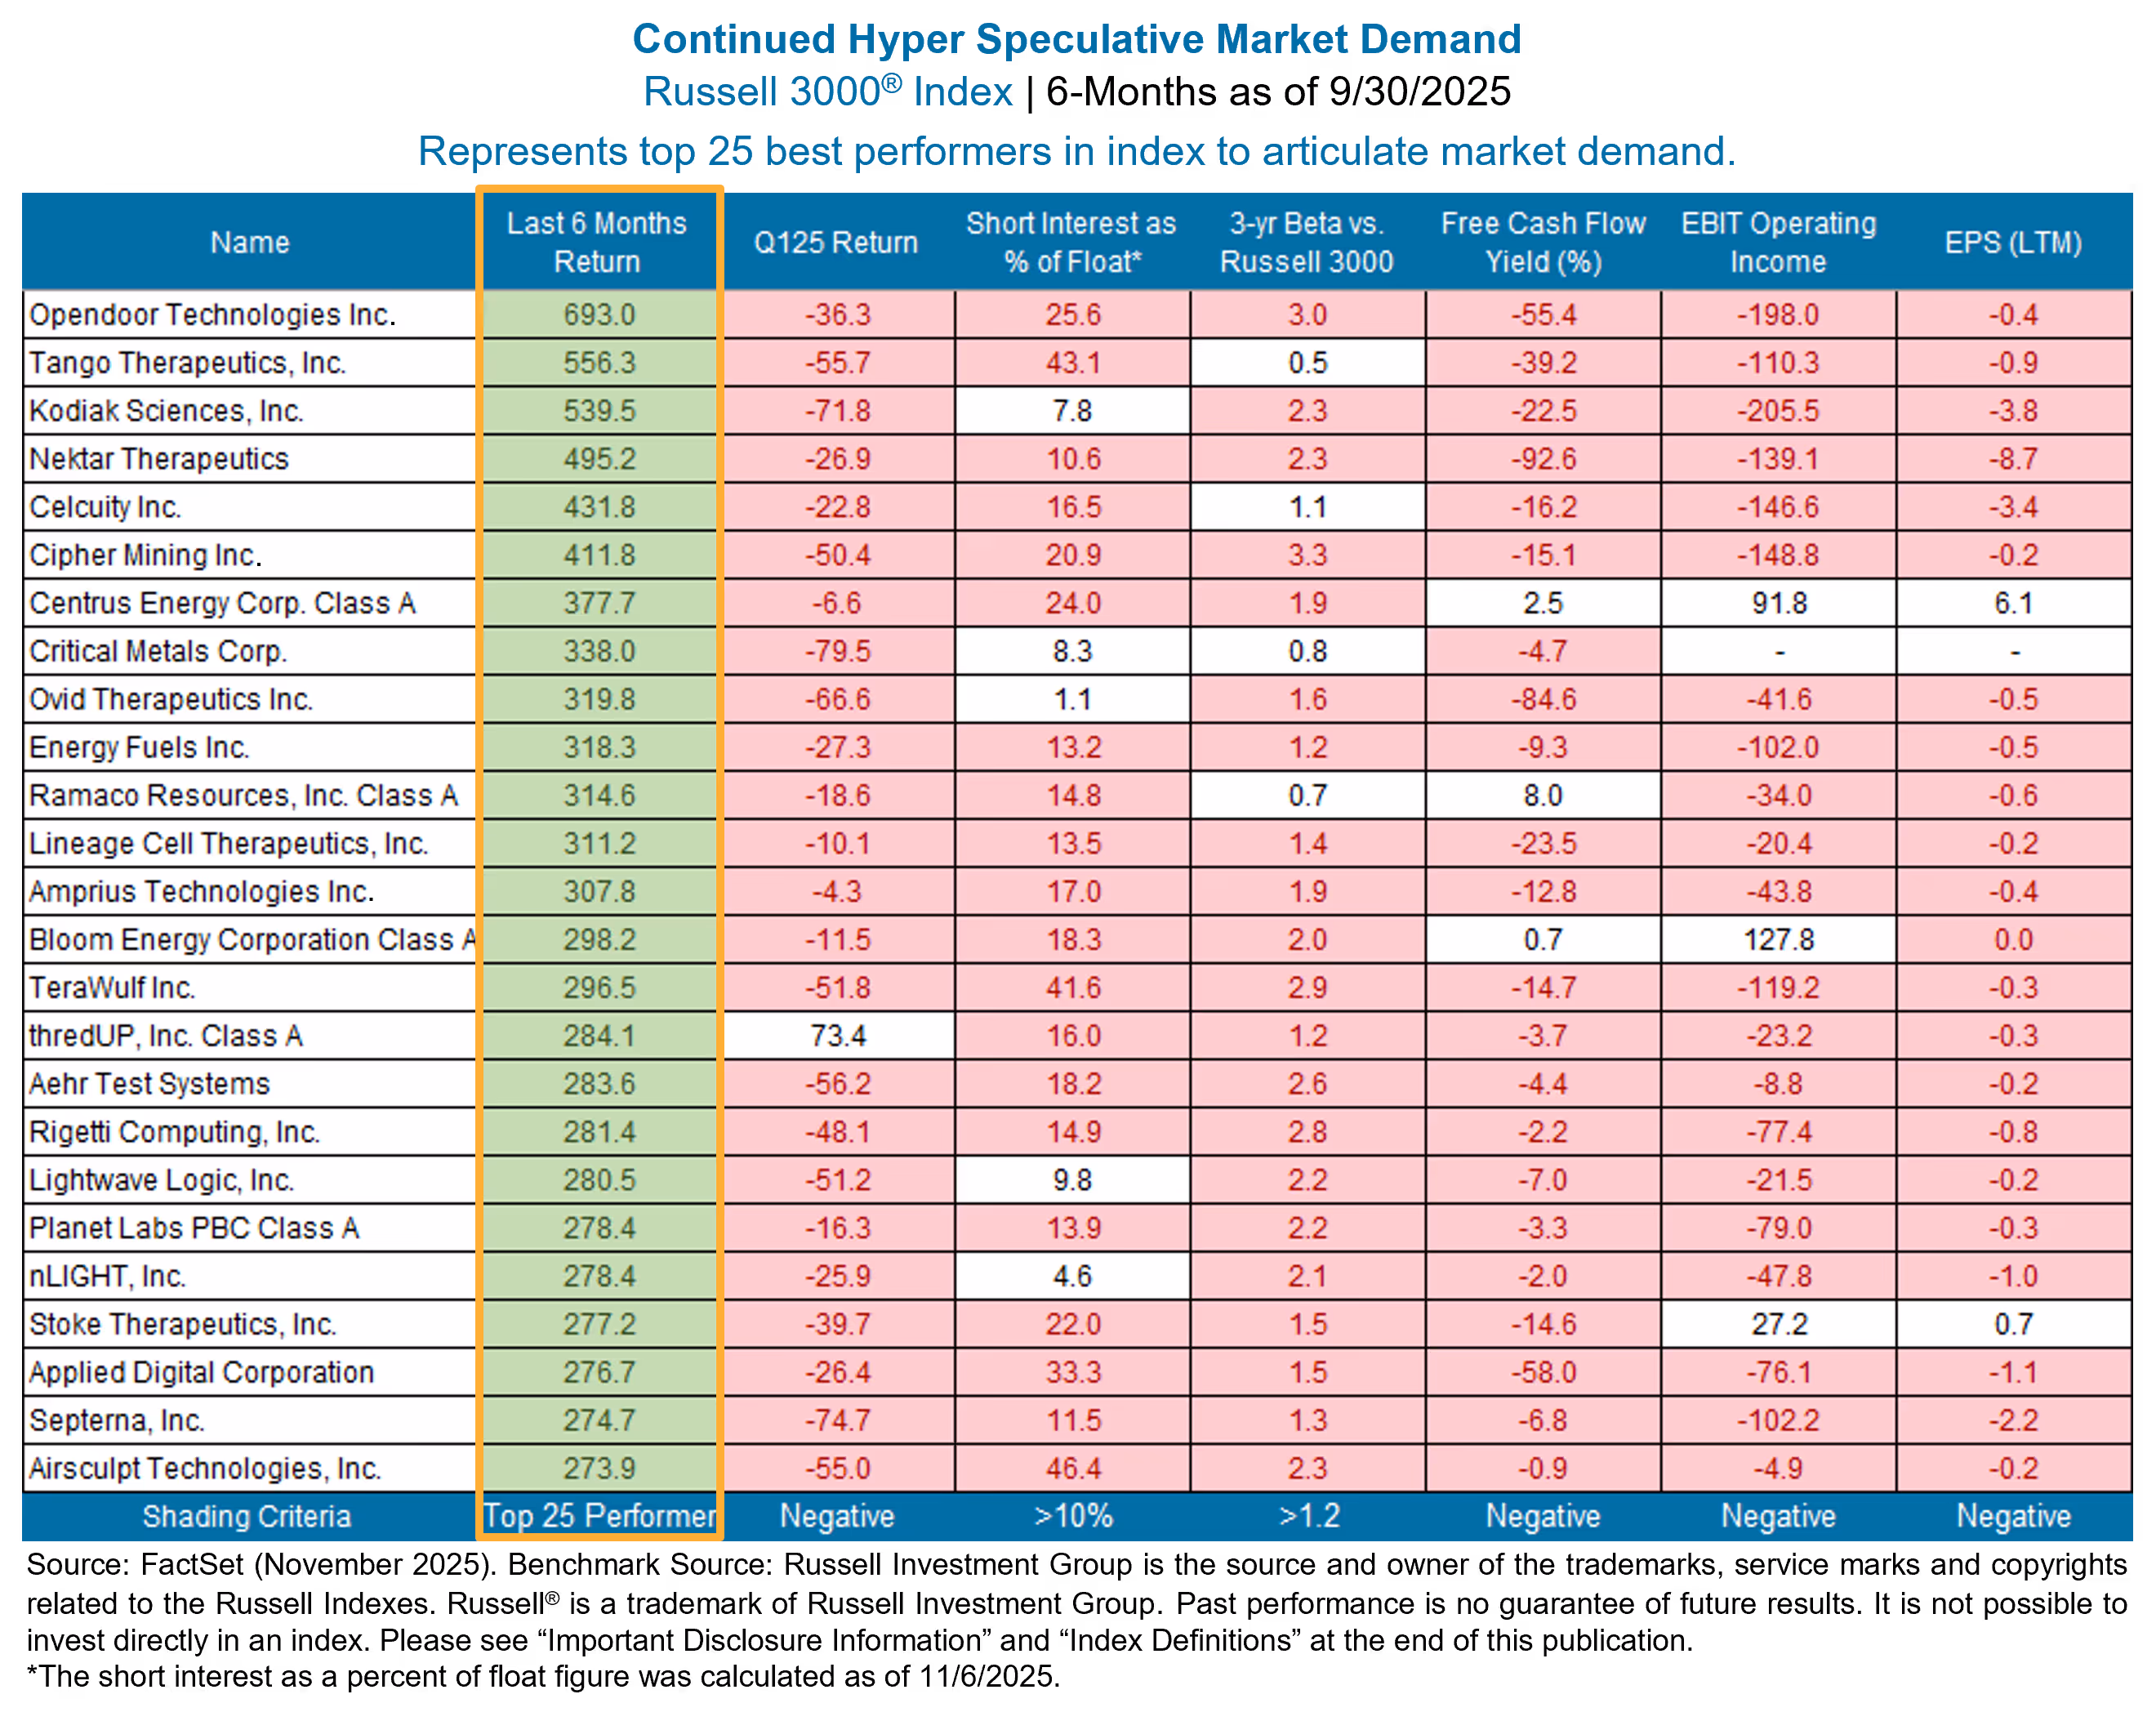
Similar to past market tops or bubbles, investors tend to be captivated by themes and certain types of securities that appear “exciting” at the time, often with little regard for valuations or fundamentals. This has certainly been the case in the current market environment as we sit in the 16th year of a growth cycle with various indices at all-time highs. This speculative backdrop was not present throughout most of the growth cycle, but has become severely pronounced over the past few years where the market has rewarded expensive momentum stocks of lower quality in general, while punishing cheaper cohorts of stocks. This backdrop has undeniably been even more exacerbated over the past two quarters. As depicted on the next page for the Russell 3000® Index (as a proxy for the broad market), what is moving the market are securities with truly speculative characteristics as defined by the cross section of negative earnings, negative operating income, negative free cash flow, and those identified as highly shorted and very high beta (and expensive!). This is a phenomenon present across market capitalization and style, despite the market narrative on lack of breadth in the market favoring only the “Magnificent 7”.
Market Microstructure Adding Fuel to the Fire
The backdrop highlighted above has become even more pronounced due to changes in the market microstructure. For context, we have tended to believe that markets are more efficient over the medium- and long-term, but in the short-term can be quite inefficient for a host of reasons, creating dislocation and opportunities to transact. However, in the current bubble-like environment, we believe these short-term inefficiencies have risen sharply in the past handful of years, a trait not uncommon in market tops. We believe this is partially due to structural changes in the market, where a growing share of assets and trading volume are driven by participants who do not fundamentally value individual businesses. Rather, notable moves in stock prices appear to be driven by factors such as price momentum (e.g., passive investing), sentiment amplified through social media and even collusion (e.g., meme stock activity among retail investors), hyper–short-term levered trading (increased options trading and pod shop activity), and other biases. These influences have intensified the market’s “pendulum effect,” causing swings that move further than what, in our view, would typically be considered efficient or rational (notably skewed in the direction of speculation given the recent backdrop described).
Index Construction
The combination of the excessive risk-on behavior in the market that has clearly not been isolated to the “Magnificent 7”, in tandem with the shift in market microstructure highlighted, has created significant bifurcation in the market. This has also had meaningful impact on index construction between growth and value indices driven by how different index providers classify these styles. These drivers have led to notable concentration in growth indices dominated by more expensive, high growth companies across the market capitalization spectrum. Conversely, value indices have become more diversified, containing companies with arguably a wider set of both value and growth characteristics. However, we would argue that with the notable skew in names coming from the growth indices into the value indices, it has further contributed to the already present severe bifurcation between expensive and cheaper cohorts of stocks in value indices.
If one takes the Russell Midcap® Growth Index, for example, and compares it to the Russell Midcap® Value Index, this shift becomes very clear. Both indices contained roughly 500 names 20 years ago, but due to the impact of all the dynamics referenced, there are only a mere 281 names in the Growth index, and a large increase in value constituents to 718. Those names that have left growth and come into value have arguably contributed to creating a more “all encompassing” index that contains a wider breadth of companies across valuation multiples and other fundamental characteristics. This, to us, creates a clearer picture of why the bifurcation between cheaper cohorts of value and more expensive cohorts is historically wide, particularly in relation to the extended growth cycle we currently live in. This is also a core reason to why we believe sub-styles of value in U.S. equities are incredibly relevant as one compares trailing performance of managers engaged in different styles of value, as well as considers these specific value styles in context to the opportunity that lies ahead.
We believe the various drivers of the market and more notable froth and exuberance present today have some clear implications, notably:
A) Overall fragility in the marketplace. The current market demand for “exciting stocks” and notable disconnect between fundamentals amidst the most expensive market in history, has, in our view, created a pendulum that has swung excessively far in one direction akin to other market bubbles. We believe this set-up is ripe for a correction or at least a retracement of what has been in vogue, in favor of fundamentals and valuation.
B) Significant opportunity in U.S. Value. The disconnect between growth and value is substantial. Similarly, the disconnect between cheaper and expensive stocks within value is historically wide. As a result of this backdrop and likely set-up in favor of value over the next cycle, we believe discussions on sub-styles of value (i.e, traditional value vs. relative value or growth at a reasonable price) are incredibly important in U.S. equities.
C) Opportunity in Active U.S. Value. We would argue the significant favoritism for speculative, expensive stocks over the last handful of years creates a fantastic prospective opportunity for active management in general. However, we believe this is notable on the value side of the coin given significantly greater diversification and less concentration than other styles of investing and its own history.
Published November 2025
IMPORTANT DISCLOSURE: This commentary is intended for informational purposes only and does not constitute a complete description of our investment services, analysis, or performance. This commentary is in no way a solicitation or an offer to sell securities or investment advisory services. The expressed views and opinions contained herein are for informational purposes only, are based on current market conditions, and are subject to change without notice. Although information, opinions, and statistics contained herein have been obtained from sources believed to be reliable and are accurate to the best of our knowledge, Thompson, Siegel & Walmsley LLC (“TSW”) cannot and does not guarantee the accuracy, validity, timeliness, or completeness of such information and statistics made available to you for any particular purpose. This commentary should not be considered as investment advice or a recommendation of any particular security, strategy, or investment product. Past performance is not indicative of future results. No part of this commentary may be reproduced in any form, distributed, or referred to in any other publication, without express written permission of TSW.
GENERAL ECONOMIC & MARKET COMMENTARY DISCLOSURE: Comments and general market related projections are based on information available at the time of writing and believed to be accurate; are for informational purposes only, are not intended as individual or specific advice, may not represent the opinions of the entire firm and may not be relied upon for future investing. Certain information contained in this material represents or is based upon forward-looking statements, which can be identified by the use of terminology such as “may”, “will”, “should”, “expect”, “anticipate”, “target”, “project”, “estimate”, “intend”, “continue” or “believe” or the negatives thereof or other variations thereon or comparable terminology. Due to various risks and uncertainties, actual events or results or the actual performance of an Account may differ materially from those reflected or contemplated in such forward-looking statements. Investors are advised to consult with their investment professional about their specific financial needs and goals before making any investment decisions. Past performance is not indicative of future results.
HOLDINGS DISCLOSURE: The information provided in this report should not be considered a recommendation to purchase or sell any particular security. There is no assurance that any securities discussed herein will remain in an account’s portfolio at the time you receive this report or that securities sold have not been repurchased. The representative account has/may change over time. The securities discussed may not represent an account’s entire portfolio and in the aggregate may represent only a small percentage of the portfolio’s holdings. It should not be assumed that any of the securities transactions or holdings discussed were or will prove to be profitable, or that the investment recommendations or decisions made in the future will be profitable or will equal the investment performance of the securities discussed herein. Please note that this strategy invests in securities outside of the Index. A complete list of every holding and every holding’s contribution to performance during the period and the methodology of the contribution to return is available by contacting us at TSWinfo@tswinvest.com.
EQUITY SECURITIES RISK: Equity securities generally have greater risk of loss than debt securities. Stock markets are volatile, and the value of equity securities may go up or down, sometimes rapidly and unpredictably. The value of equity securities fluctuates based on real or perceived changes in a company’s financial condition, factors affecting a particular industry or industries, and overall market, economic and political conditions. If the market prices of the equity securities owned by the strategy fall, the value of your investment in the strategy will decline. Your portfolio may lose its entire investment in the equity securities of an issuer. A change in financial condition or other event affecting a single issuer may adversely impact securities markets as a whole.
PRINCIPAL RISK: Risk is inherent in all investing. Many factors and risks affect performance. The value of your investment, as well as the amount of return you receive on your investment, may fluctuate significantly day to day and over time. You may lose part or all of your investment in your portfolio or your investment may not perform as well as other similar investments. An investment in the strategy is not a bank deposit and is not insured or guaranteed by the Federal Deposit Insurance Corporation or any other government agency. You may lose money if you invest in this strategy.
VALUE INVESTING RISK: The prices of securities TSW believes are undervalued may not appreciate as anticipated or may go down. The value approach to investing involves the risk that stocks may remain undervalued, undervaluation may become more severe, or perceived undervaluation may actually represent intrinsic value. Value stocks as a group may be out of favor and underperform the overall equity market for a long period of time, for example, while the market favors “growth” stocks.
For additional information regarding potential risks to your investment please see risk disclosures in our Form ADV Part 2A found here https://www.tswinvest.com.
Index Definitions:
Russell 1000® Value: The Russell 1000® Value Index measures the performance of the large-cap value segment of the U.S. equity universe. It includes those Russell 1000 companies with relatively lower price-to-book ratios, lower I/B/E/S forecast medium term (2 year) growth and lower sales per share historical growth (5 years).
Russell Midcap® Value: The Russell Midcap® Value Index measures the performance of those Russell Midcap® Index companies with lower price-to-book- rations and lower forecasted growth values. The Index is reconstituted annually to ensure larger stocks do not distort the performance and characteristics of the midcap value market.
Russell 2000® Value: The Russell 2000® Value Index measures the performance of the small-cap value segment of the U.S. equity universe. It includes those Russell 2000® companies with relatively lower price-to-book ratios, lower I/B/E/S forecast medium term (2 year) growth and lower sales per share historical growth (5 years).
Russell 1000® Growth: The Russell 1000® Growth Index measures the performance of the large-cap growth segment of the U.S. equity universe. It includes those Russell 1000 companies with relatively higher price-to-book ratios, higher I/B/E/S forecast medium term (2 year) growth and higher sales per share historical growth (5 years).
Russell Midcap® Growth: The Russell Midcap® Growth Index measures the performance of the mid-cap growth segment of the U.S. equity universe. It includes those Russell Midcap® Index companies with relatively higher price-to-book ratios, higher I/B/E/S forecast medium term (2 year) growth and higher sales per share historical growth (5 years).
Russell 2000® Growth: The Russell 2000® Growth Index measures the performance of the small-cap growth segment of the U.S. equity universe. It includes those Russell 2000 companies with relatively higher price-to-book ratios, higher I/B/E/S forecast medium term (2 year) growth and higher sales per share historical growth (5 years).
Russell 3000® Index: The Russell 3000® Index measures the performance of the largest 3,000 U.S. companies representing approximately 96% of the investable U.S.. equity market, as of the most recent reconstitution.
© 2025 Thompson, Siegel & Walmsley LLC (“TSW”). TSW is an investment adviser registered with the SEC. Registration does not imply a certain level of skill or training. All information contained herein is believed to be correct but accuracy cannot be guaranteed. TSW and its employees do not provide tax or legal advice. Past performance is not indicative of future results; past performance does not guarantee future results, and other calculation methods may produce different results. There is the possibility of loss of principal value. Certain GIPS® disclosures are provided on TSW’s website at www.tswinvest.com, others are available upon request. TSW is a trademark in the United States Patent and Trademark Office.
Subscribe to receive the latest news and updates
You are now leaving the TSW website. This link is provided as a convenience, and Thompson, Siegel & Walmsley is not responsible for the content provided on your destination site.
You are now leaving the TSW website. This link is provided as a convenience, and Thompson, Siegel & Walmsley is not responsible for the content provided on your destination site.
You are now leaving the TSW website. This link is provided as a convenience, and Thompson, Siegel & Walmsley is not responsible for the content provided on your destination site.