(804) 353-4500tswinfo@tswinvest.com
You are leaving TSW
You are now leaving the TSW website. This link is provided as a convenience, and Thompson, Siegel & Walmsley is not responsible for the content provided on your destination site.
You are now leaving the TSW website. This link is provided as a convenience, and Thompson, Siegel & Walmsley is not responsible for the content provided on your destination site.
At TSW we define ourselves as a traditional value manager who seeks to identify stocks that trade at a discount to intrinsic value, with identifiable catalysts that are likely to close the valuation gap over a 2–3-year time frame, on average. We follow a consistent and repeatable fundamentally oriented process that has been time tested across a variety of market cycles.
When considering exposure to U.S. large cap equities, we believe we are living in a unique period where the Russell 1000® Value Index continues to trade at close to a historic relative valuation discount to its growth counterpart. This is partially explainable by growth’s outperformance in the current cycle, exacerbated heavily by what we believe to be a market exhibiting various signs of a classic bubble that is being expressed more on the growth side of the coin. One can see evidence of this in the material concentration in the Russell 1000® Growth Index, which is at a stark contrast to the more diversified Russell 1000® Value Index. Specifically, as of 3/31/2025, the top five names in the Russell 1000® Growth Index (Microsoft, Apple, NVIDIA, Amazon, and Meta) account for nearly 43% of the entire index, representing close to the highest concentration in more than 20 years. This is compared to the more diversified Russell 1000® Value Index that contains just 12% in the top five names.

There has been a general belief in the industry that as one migrates further up the market capitalization ladder, market efficiency is greater, therefore creating a more difficult backdrop to generate alpha. However, we have seen the opposite when speaking specifically to large cap value due to the composition of the Russell 1000® Value Index. Unlike active large cap core and growth managers who may be concerned with large benchmark positions driving performance, the large cap value universe contains an attractive and diverse opportunity set for active managers with less influence by behemoth holdings making up the Index composition.
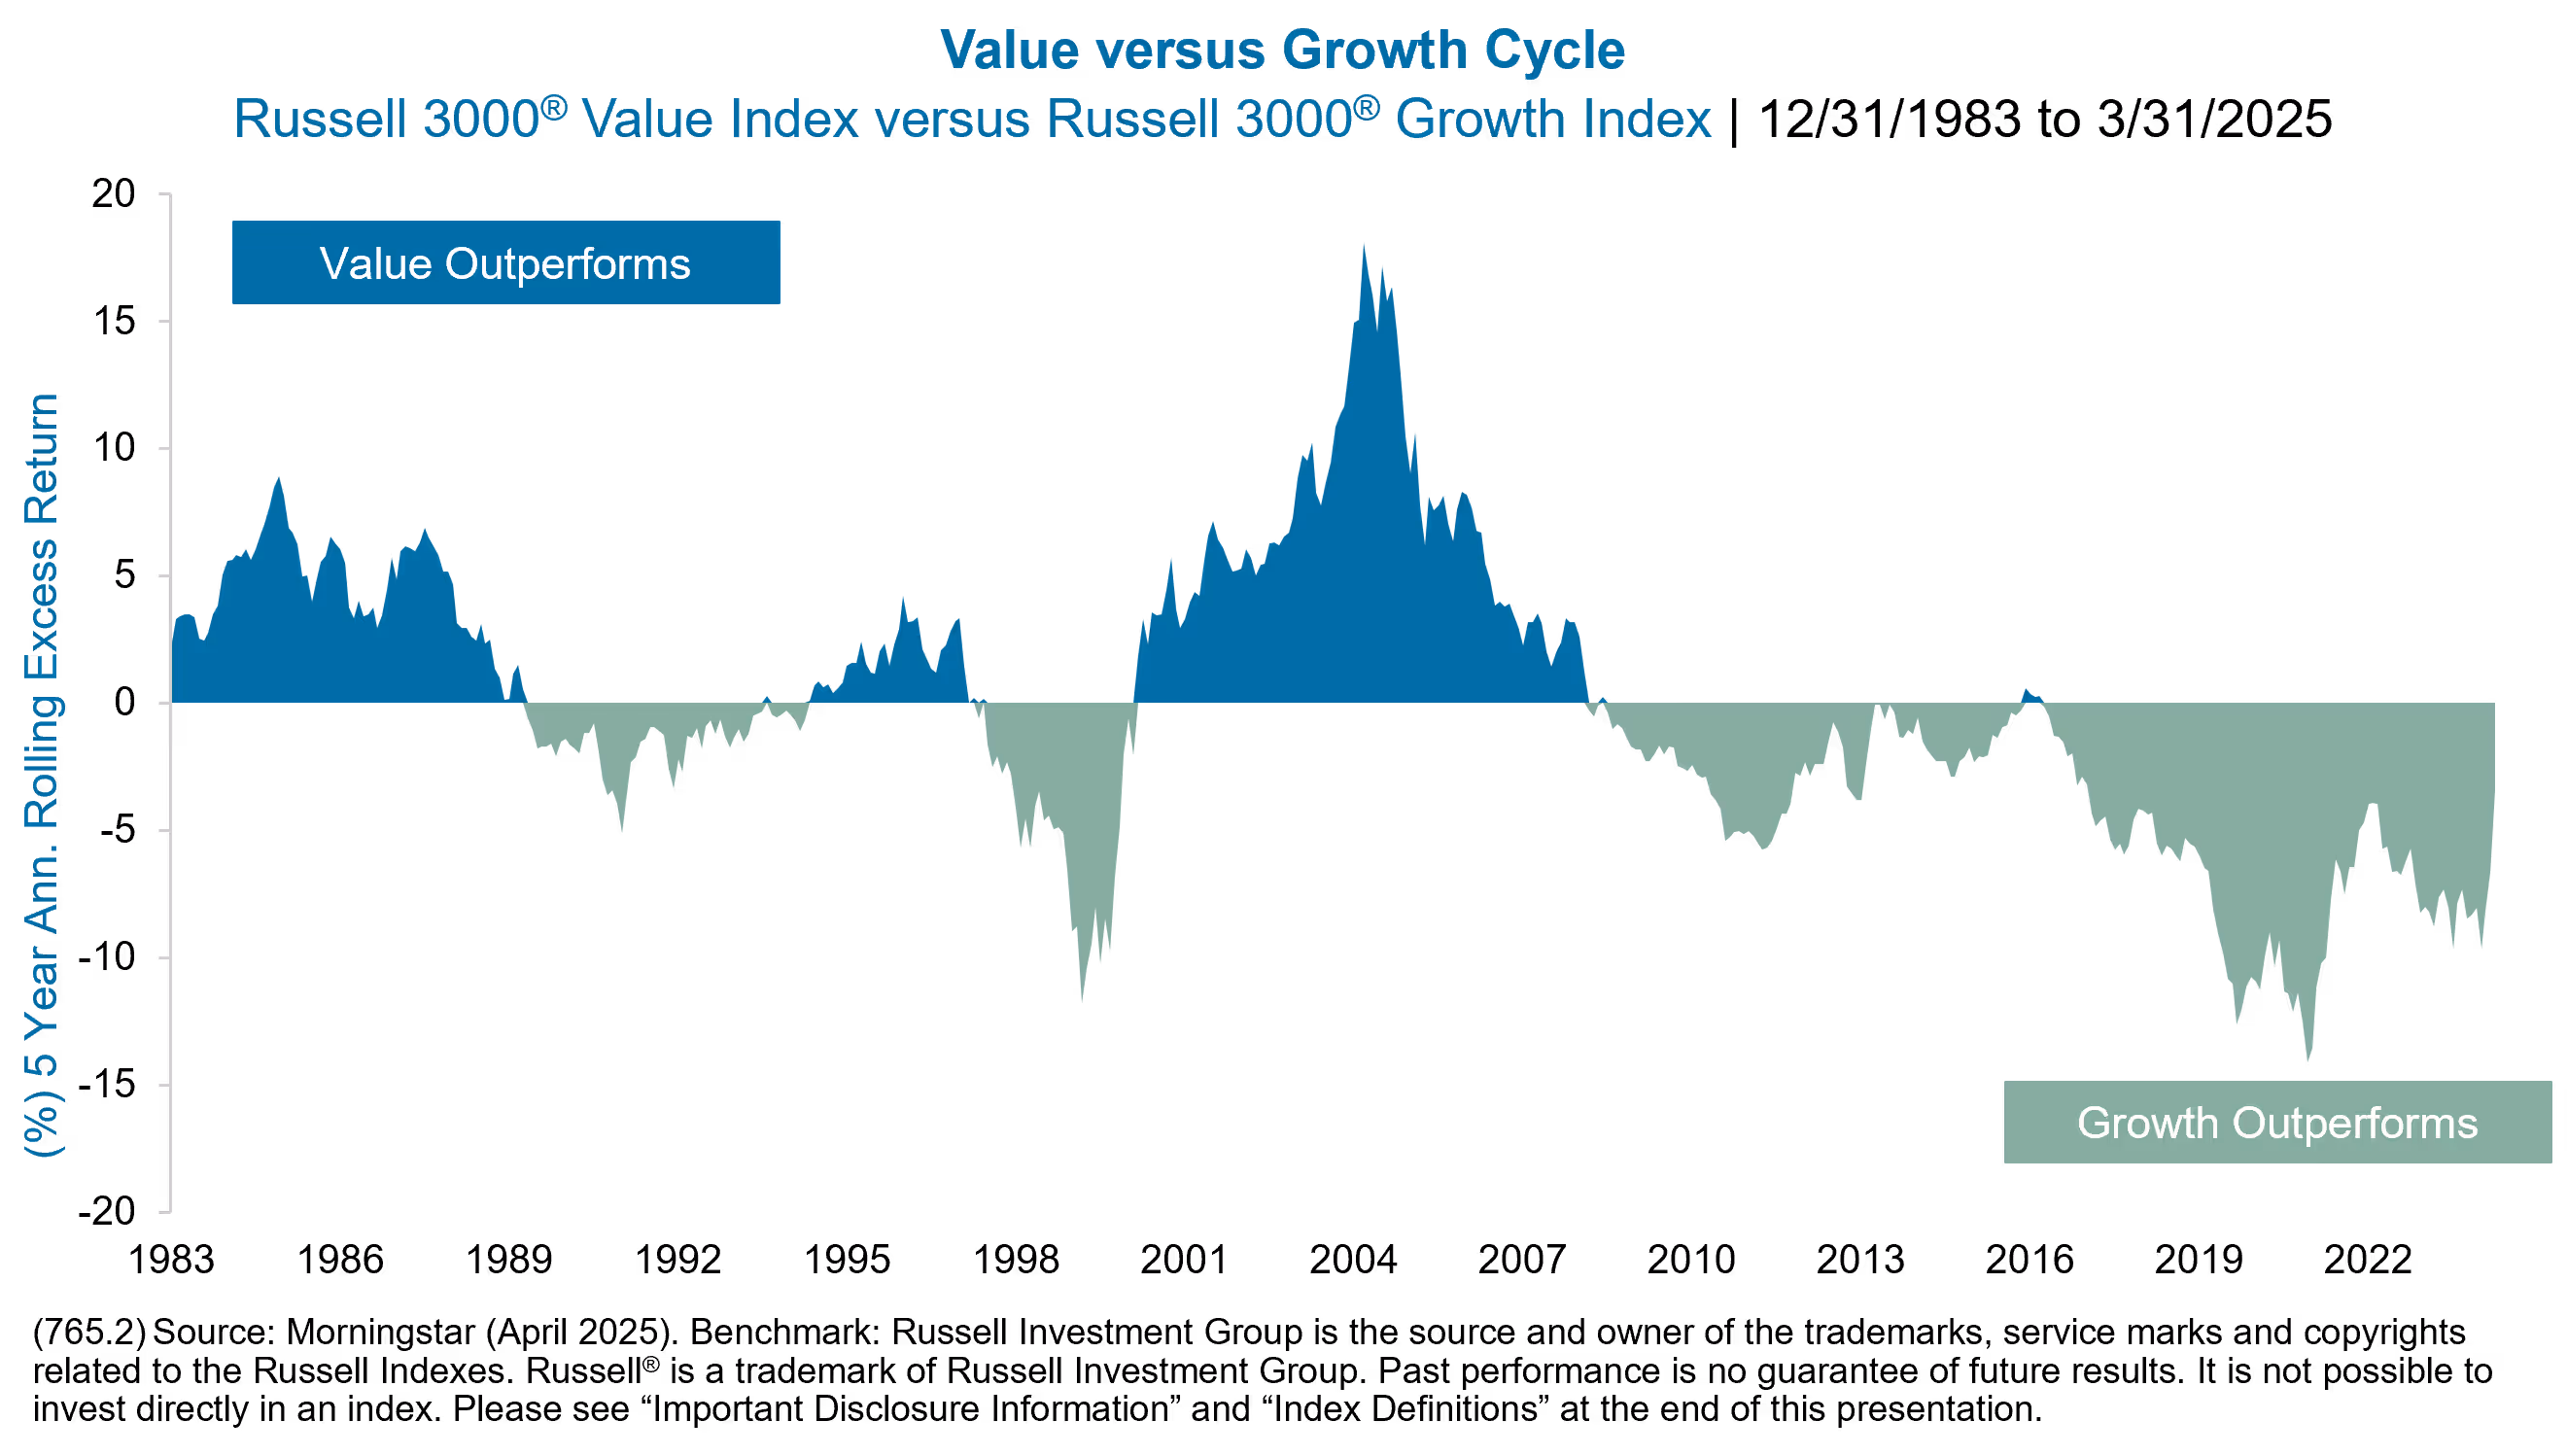
The chart below illustrates historical rotations between value and growth within the broad U.S. market, as represented by the Russell 3000® Value versus Russell 3000® Growth, over rolling five-year periods. As one can see, the current dynamic between value and growth is longer in duration than what preceded the dot-com bubble, with the spread larger in magnitude. We believe the current market dislocation is at historic levels, most notably within the value style. Similarly, even within value, we have noticed a substantial mispricing between cheaper and more expensive cohorts of stocks.
We believe TSW Large Cap Value is a truly differentiated offering relative to peers that offers clients the following key attributes:
A) Consistent, repeatable process delivered by a stable and tenured team that is designed to outperform in a variety of market environments. Equally important is the strategy’s ability to limit downside capture relative to the Russell 1000® Value Index. We would argue this attribute is always important, but even more so today as we sit in a historically expensive market that has been predominantly driven by multiple expansion most recently.
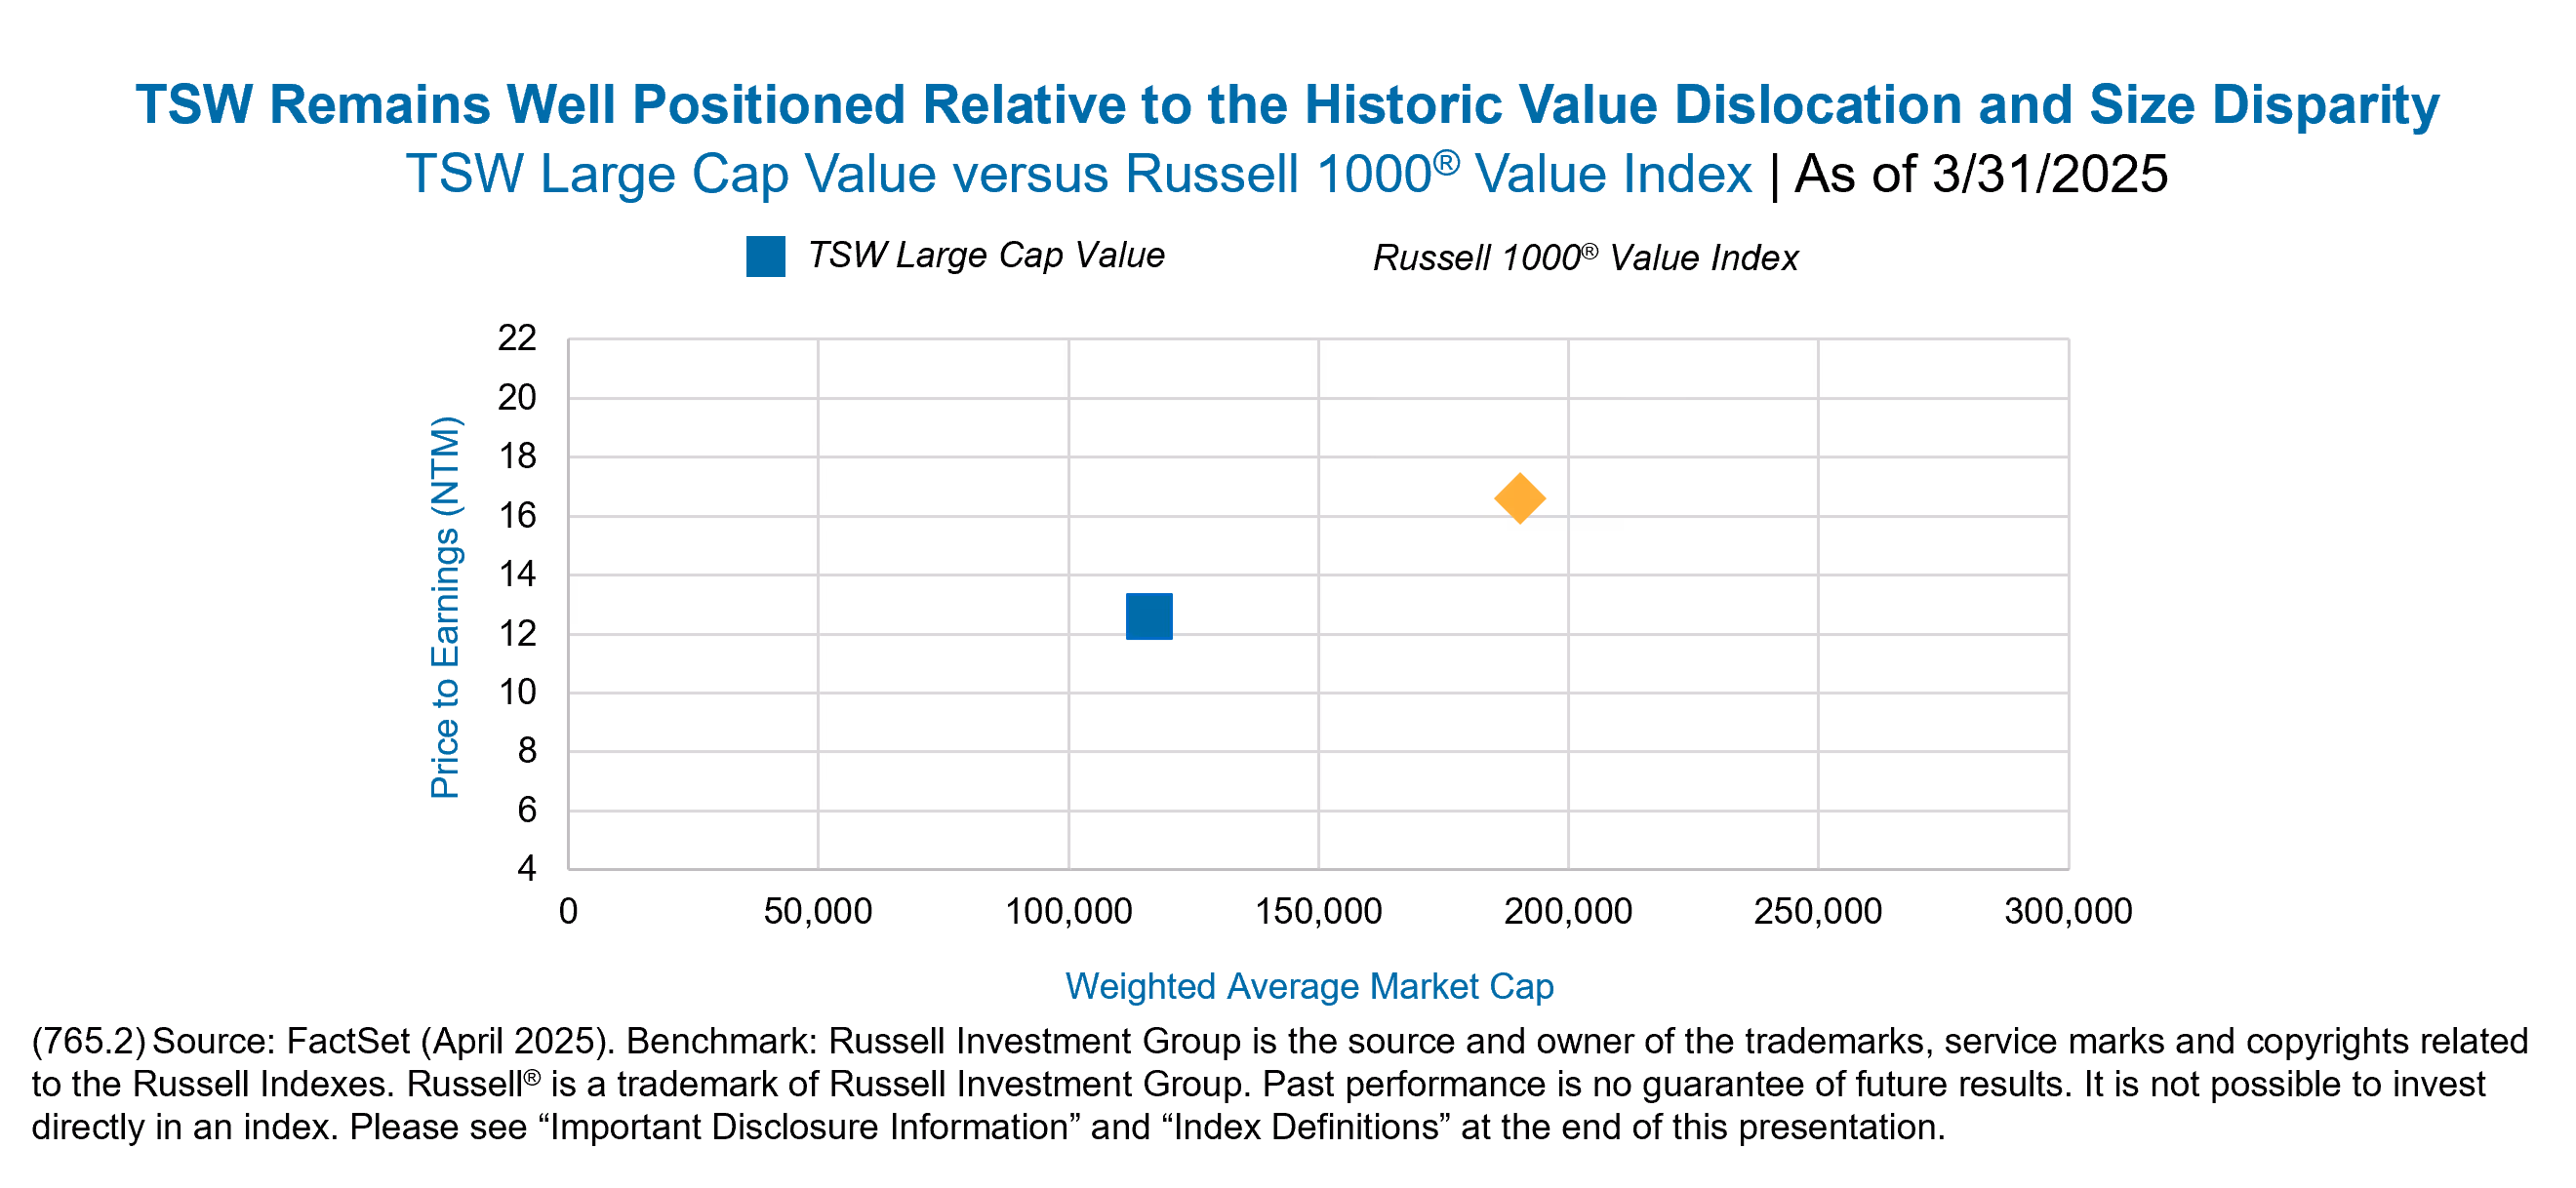
B) Style pure, price sensitive and discount value posture relative to most peers and the Russell 1000® Value Index against a historic dislocation between growth and value, and even within value, cheaper and more expensive cohorts of stocks; and
C) Modestly smaller market capitalization footprint within the Large Cap Value universe given the severe dislocation between larger and smaller cohorts of stocks.
In our view, this is one of the best times in history to take advantage of the severe market dislocation, notably within the value opportunity set, and for those that have a true price-sensitive approach to value investing.
IMPORTANT DISCLOSURE: This commentary is intended for informational purposes only and does not constitute a complete description of our investment services, analysis, or performance. This commentary is in no way a solicitation or an offer to sell securities or investment advisory services. The expressed views and opinions contained herein are for informational purposes only, are based on current market conditions, and are subject to change without notice. Although information, opinions, and statistics contained herein have been obtained from sources believed to be reliable and are accurate to the best of our knowledge, Thompson, Siegel & Walmsley LLC (“TSW”) cannot and does not guarantee the accuracy, validity, timeliness, or completeness of such information and statistics made available to you for any particular purpose. This commentary should not be considered as investment advice or a recommendation of any particular security, strategy, or investment product. Past performance is not indicative of future results. No part of this commentary may be reproduced in any form, distributed, or referred to in any other publication, without express written permission of TSW.
GENERAL ECONOMIC & MARKET COMMENTARY DISCLOSURE: Comments and general market related projections are based on information available at the time of writing and believed to be accurate; are for informational purposes only, are not intended as individual or specific advice, may not represent the opinions of the entire firm and may not be relied upon for future investing. Certain information contained in this material represents or is based upon forward-looking statements, which can be identified by the use of terminology such as “may”, “will”, “should”, “expect”, “anticipate”, “target”, “project”, “estimate”, “intend”, “continue” or “believe” or the negatives thereof or other variations thereon or comparable terminology. Due to various risks and uncertainties, actual events or results or the actual performance of an Account may differ materially from those reflected or contemplated in such forward-looking statements. Investors are advised to consult with their investment professional about their specific financial needs and goals before making any investment decisions. Past performance is not indicative of future results.
HOLDINGS DISCLOSURE: The information provided in this report should not be considered a recommendation to purchase or sell any particular security. There is no assurance that any securities discussed herein will remain in an account’s portfolio at the time you receive this report or that securities sold have not been repurchased. The representative account has/may change over time. The securities discussed may not represent an account’s entire portfolio and in the aggregate may represent only a small percentage of the portfolio’s holdings. It should not be assumed that any of the securities transactions or holdings discussed were or will prove to be profitable, or that the investment recommendations or decisions made in the future will be profitable or will equal the investment performance of the securities discussed herein. Please note that this strategy invests in securities outside of the Index. A complete list of every holding and every holding’s contribution to performance during the period and the methodology of the contribution to return is available by contacting us at TSWinfo@tswinvest.com.
EQUITY SECURITIES RISK: Equity securities generally have greater risk of loss than debt securities. Stock markets are volatile, and the value of equity securities may go up or down, sometimes rapidly and unpredictably. The value of equity securities fluctuates based on real or perceived changes in a company’s financial condition, factors affecting a particular industry or industries, and overall market, economic and political conditions. If the market prices of the equity securities owned by the strategy fall, the value of your investment in the strategy will decline. Your portfolio may lose its entire investment in the equity securities of an issuer. A change in financial condition or other event affecting a single issuer may adversely impact securities markets as a whole.
PRINCIPAL RISK: Risk is inherent in all investing. Many factors and risks affect performance. The value of your investment, as well as the amount of return you receive on your investment, may fluctuate significantly day to day and over time. You may lose part or all of your investment in your portfolio or your investment may not perform as well as other similar investments. An investment in the strategy is not a bank deposit and is not insured or guaranteed by the Federal Deposit Insurance Corporation or any other government agency. You may lose money if you invest in this strategy.
VALUE INVESTING RISK: The prices of securities TSW believes are undervalued may not appreciate as anticipated or may go down. The value approach to investing involves the risk that stocks may remain undervalued, undervaluation may become more severe, or perceived undervaluation may actually represent intrinsic value. Value stocks as a group may be out of favor and underperform the overall equity market for a long period of time, for example, while the market favors “growth” stocks.
For additional information regarding potential risks to your investment please see risk disclosures in our Form ADV Part 2A found here https://www.tswinvest.com.
INDEX DEFINTIONS:
Russell 1000® Value Index:The Russell 1000® Value Index measures the performance of the large-cap value segment of the U.S. equity universe. It includes those Russell 1000 companies with relatively lower price-to-book ratios, lower I/B/E/S forecast medium term (2 year) growth and lower sales per share historical growth (5 years).
Russell 1000® Growth Index: The Russell 1000® Growth Index measures the performance of the large-cap growth segment of the U.S. equity universe. It includes those Russell 1000 companies with relatively higher price-to-book ratios, higher I/B/E/S forecast medium term (2 year) growth and higher sales per share historical growth (5 years).
Russell 3000® Value Index: The Russell 3000® Value Index measures the performance of the broad value segment of the US equity value universe. It includes those Russell 3000 companies with relatively lower price-to-book ratios, lower I/B/E/S forecast medium term (2 year) growth and lower sales per share historical growth (5 years).
Russell 3000® Growth Index: The Russell 3000® Growth Index measures the performance of the broad growth segment of the US equity universe. It includes those Russell 3000 companies with relatively higher price-to-book ratios, higher I/B/E/S forecast medium term (2 year) growth and higher sales per share historical growth (5 years).
© 2025 Thompson, Siegel & Walmsley LLC (“TSW”). TSW is an investment adviser registered with the SEC. Registration does not imply a certain level of skill or training. All information contained herein is believed to be correct but accuracy cannot be guaranteed. TSW and its employees do not provide tax or legal advice. Past performance is not indicative of future results; past performance does not guarantee future results, and other calculation methods may produce different results. There is the possibility of loss of principal value. Certain GIPS® disclosures are provided on TSW’s website at www.tswinvest.com, others are available upon request. TSW is a trademark in the United States Patent and Trademark Office.
Subscribe to receive the latest news and updates
You are now leaving the TSW website. This link is provided as a convenience, and Thompson, Siegel & Walmsley is not responsible for the content provided on your destination site.
You are now leaving the TSW website. This link is provided as a convenience, and Thompson, Siegel & Walmsley is not responsible for the content provided on your destination site.
You are now leaving the TSW website. This link is provided as a convenience, and Thompson, Siegel & Walmsley is not responsible for the content provided on your destination site.